Activity belongs to the source; count rate belongs to the detector. Correct the latter for background before interpreting the source’s decay pattern.
By the end, you should be able to:
Distinguish activity from measured count rate.
Find half-life from corrected data.
Explain randomness and qualified lifetime hazards.
Before you revise
Diagnostic question
Choose an answer from memory. Your result tells you what to watch for in the guide.
Core revision guide
Learn the model, then use it
Activity belongs to the source; count rate belongs to the detector. Correct the latter for background before interpreting the source’s decay pattern.
01
Keep the measured quantities separate
Scope: 8463 and 8464 · Foundation and Higher
Activity is the number of nuclear decays per second in the source, in becquerels (Bq). Count rate is detector events per second or minute and depends on geometry and detection efficiency. A detector usually records only a fraction of emitted radiation. Corrected source count rate = gross measured count rate − background rate. Do not label a detector count rate as Bq without a justified calibration.
02
Repeated halving and graphs
Scope: 8463 and 8464 · Foundation and Higher
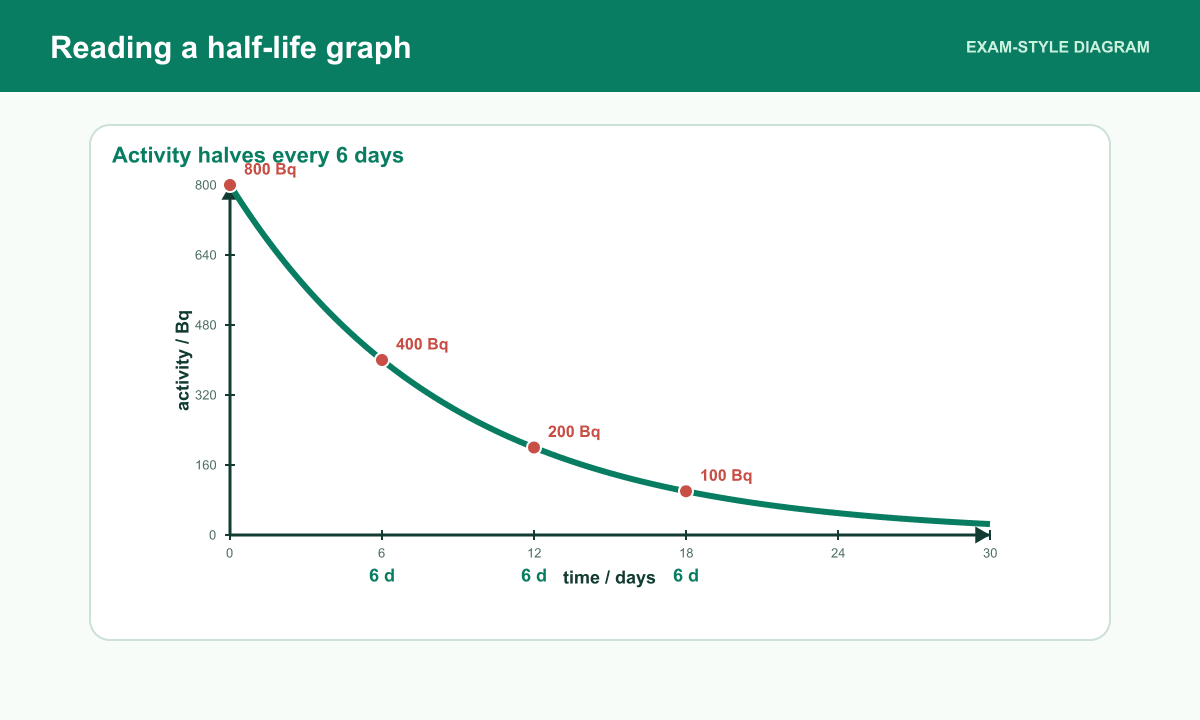
Half-life is the time for undecayed nuclei or source activity to halve; background-corrected count rate follows the same fractional trend if the detector arrangement stays fixed. For 640 Bq and a 3 h half-life, after 9 h activity is 80 Bq. Source activity and corrected source counts approach zero. Only the gross measured count curve approaches a steady background level.
03
Random does not mean patternless
Scope: 8463 and 8464 · Foundation and Higher
You cannot predict which nucleus decays or exactly when. A large sample has a predictable statistical trend; small count totals fluctuate more. Measure background for a sufficiently long fixed interval, compare rates using the same time unit, and keep source-detector distance and absorber geometry fixed.
04
Link half-life to a hazard judgement
Scope: 8463 Physics only · Foundation and Higher
When comparing sources, say whether their initial activity or initial number of nuclei is equal. A shorter half-life means activity falls sooner, but for equal initial numbers it also means a higher initial decay rate. Long-lived contamination persists for longer. The linked Radiation Hazards guide applies these ideas to supplied dose and medical-use data, so a half-life alone does not decide which source is safer.
Equal 6-day intervals halve the activity; background count must be considered when using measured count rate.Open the full-size exam diagram
Source activityA = A₀(½)ⁿBq; n is elapsed half-livesCorrect detector backgroundsource count rate = gross rate − background ratecounts/s or counts/min, consistently
Misconception clinic
Replace the tempting answer
Read each belief, say what is wrong with it, then compare your correction.
Tempting idea: 102 counts/min.
Use instead: Background must be subtracted. 90 − 12 = 78 counts/min.
Tempting idea: The source activity graph in Bq.
Use instead: Source activity tends toward zero. Gross counts include background.
Retrieval practice
Quick checks
Explore the relationship
Half-life data model
Choose a starting activity and number of half-lives, then calculate A = A₀ × (½)ⁿ.
Model scope: 8463 and 8464 · Foundation and Higher
What to notice: use the readout to describe how one variable changes when the other is controlled.
Worked examples
See the method being built
Apply keep the measured quantities separate in the worked reasoning, then try the changed-context questions below.
Example 1 · Repeated halving
Scope: 8463 and 8464 · Foundation and Higher
A source has activity 640 Bq and half-life 3 h. Find activity after 9 h.
9 h is three half-lives.
Halve three times: 640 → 320 → 160 → 80.
Give Bq.
Show the answer
Activity = 80 Bq.
Example 2 · Background correction
Scope: 8463 and 8464 · Foundation and Higher
A detector measures 90 counts/min near a source; background is 12 counts/min. Find corrected count.
State the raw count.
Subtract background.
Use corrected value in comparisons.
Show the answer
Corrected count rate = 90 − 12 = 78 counts/min.
Example 3 · Random decay
Scope: 8463 and 8464 · Foundation and Higher
Explain how radioactive decay can be random but a half-life predictable.
Describe one nucleus.
Describe a large sample.
Link to probability.
Show the answer
Each nucleus decays unpredictably, but many nuclei have a stable average probability, giving a predictable halving pattern.
Exam precision
Use the physics precisely
Do this: Subtract background before comparing halves. Keep geometry fixed and state the comparison conditions before using half-life to discuss a hazard.
Independent practice
Exam-style questions
Write an answer before opening the marking guidance. Then edit the exact phrase or step that would gain the next mark.
1. A source has gross rate 84 counts/min and background 4 counts/min. Three half-lives later predict the gross rate.
[3 marks]
Scope: 8463 and 8464 · Foundation and Higher
Show marking guidance and model answer
Original PhysicsUK mark scheme: Point 1 (1 mark): Initial source rate = 84 − 4 = 80 counts/min. Point 2 (1 mark): Source rate after three half-lives = 80/8 = 10 counts/min. Point 3 (1 mark): Gross rate = 10 + 4 = 14 counts/min. Award each distinct point once. Accept equivalent scientifically correct wording. No half marks.
Source rate after three half-lives = 80/8 = 10 counts/min. (1 mark)
Gross rate = 10 + 4 = 14 counts/min. (1 mark)
Model answer: Subtract background: 80 counts/min. Three halvings give 10 counts/min from the source, then add 4 to predict 14 counts/min gross.
Marking notes: Award later valid halving or addition method after an earlier arithmetic error; do not credit a method that halves the background.
2. Explain why decay can be random but half-life useful.
[2 marks]
Scope: 8463 and 8464 · Foundation and Higher
Show marking guidance and model answer
Original PhysicsUK mark scheme: Point 1 (1 mark): Individual decay time/identity cannot be predicted. Point 2 (1 mark): Large populations have a stable statistical halving pattern. Award each distinct point once. Accept equivalent scientifically correct wording. No half marks.
Individual decay time/identity cannot be predicted. (1 mark)
Large populations have a stable statistical halving pattern. (1 mark)
Model answer: An individual nucleus is unpredictable, but the large-sample average gives a useful halving time.
Questions pupils ask
Half-Life and Radioactive Decay FAQs
Is a detector count rate the same as source activity?
No. Activity counts all decays per second, whereas a detector records only the fraction it detects and includes background unless corrected.