A graph gives a quantitative relationship. The axes determine what its gradient and area mean; the line should represent a justified model of the data.
A graph gives a quantitative relationship. The axes determine what its gradient and area mean; the line should represent a justified model of the data.
By the end, you should be able to:
Plot data with labelled axes and a suitable trend.
Calculate a physical gradient using a large triangle.
Judge scatter and anomalies from evidence.
Before you revise
Diagnostic question
Choose an answer from memory. Your result tells you what to watch for in the guide.
Core revision guide
Learn the model, then use it
A graph gives a quantitative relationship. The axes determine what its gradient and area mean; the line should represent a justified model of the data.
01
Plot and fit
Scope: 8463 and 8464 · Foundation and Higher
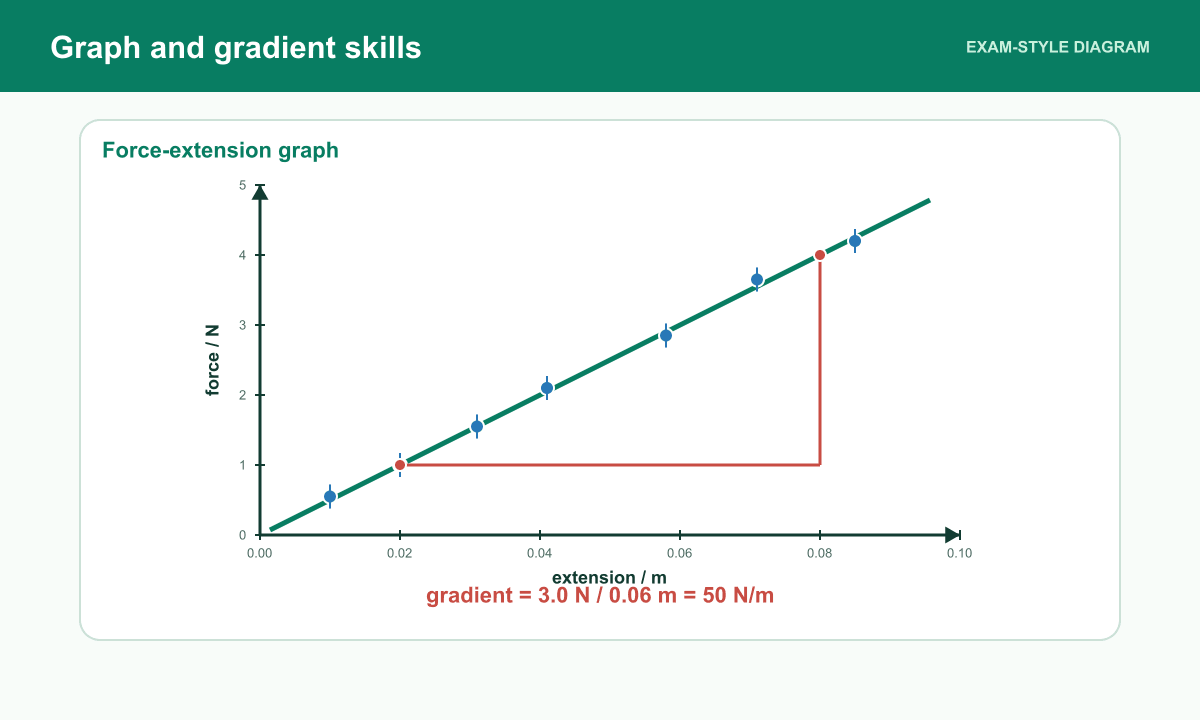
Put the independent variable on x and dependent on y unless the task specifies otherwise. Label quantities and units, choose even usable scales and plot accurately. Use a best-fit line or smooth curve appropriate to the model; do not join measurement noise point by point. A proportional relationship needs a straight trend through the origin, not merely an increasing trend.
02
Gradient with physical units
Scope: 8463 and 8464 · Foundation and Higher
Choose two well-separated points on the fitted straight line, not necessarily raw data points. Gradient = Δy/Δx. On F (N) against e (m), gradient is k in N/m. On E (J) against Δθ (°C), gradient is mc in J/°C; divide by mass to obtain c. Reversing axes reverses the relationship.
03
Evaluate scatter and anomalies
Scope: 8463 and 8464 · Foundation and Higher
Repeat an unexpected reading to investigate it and document any justified exclusion. A mean reduces random scatter; it does not remove a calibration offset. A line forced through zero can hide a real intercept. Error bars are useful when supplied or requested; use their meaning given in the task rather than inventing a universal rule.
Read each belief, say what is wrong with it, then compare your correction.
Tempting idea: 100 m/N, compliance.
Use instead: Those would apply to reversed axes. F/e is k with N/m.
Tempting idea: It is automatically directly proportional.
Use instead: Proportionality needs origin passage. Linear and proportional are different claims.
Retrieval practice
Quick checks
Worked examples
See the method being built
Apply plot and fit in the worked reasoning, then try the changed-context questions below.
Example 1 · Gradient
Scope: 8463 and 8464 · Foundation and Higher
A best-fit line rises by 12 units while x increases by 4 units. Calculate the gradient.
Use gradient = change in y ÷ change in x.
12 ÷ 4 = 3.
Show the answer
3 units of y per unit of x.
Example 2 · Line of best fit
Scope: 8463 and 8464 · Foundation and Higher
Why should the line of best fit not be forced through every point?
Measurements include random variation.
The line should show the overall trend.
Outliers should be considered rather than ignored silently.
Show the answer
It represents the overall pattern, allowing for experimental scatter rather than joining every point.
Example 3 · Gradient in context
Scope: 8463 and 8464 · Foundation and Higher
A graph of energy against temperature change has gradient mc. What does dividing the gradient by mass give?
Gradient = m c.
Divide both sides by m.
Show the answer
Specific heat capacity c.
Exam precision
Use the physics precisely
Do this: Use two widely separated points on the fitted line for gradient. State what the scatter suggests and justify any repeat or anomaly decision.
Independent practice
Exam-style questions
Write an answer before opening the marking guidance. Then edit the exact phrase or step that would gain the next mark.
1. On a force-against-extension best-fit line, points (0.010 m, 2.0 N) and (0.050 m, 10 N) lie on the line. Calculate its gradient and name the quantity.
[3 marks]
Scope: 8463 and 8464 · Foundation and Higher
Show marking guidance and model answer
Original PhysicsUK mark scheme: Point 1 (1 mark): Gradient = ΔF/Δe. Point 2 (1 mark): Gradient = (10 − 2.0)/(0.050 − 0.010). Point 3 (1 mark): Gradient = 200 N/m, the spring constant. Award each distinct point once. Accept equivalent scientifically correct wording. No half marks.
Gradient = ΔF/Δe. (1 mark)
Gradient = (10 − 2.0)/(0.050 − 0.010). (1 mark)
Gradient = 200 N/m, the spring constant. (1 mark)
Model answer: Gradient = ΔF/Δe. Gradient = (10 − 2.0)/(0.050 − 0.010). Gradient = 200 N/m, the spring constant.
Acceptable answers: Expected result: Gradient = 200 N/m, the spring constant. Accept the unrounded value or a correctly rounded equivalent to two or more significant figures; accept equivalent units if converted correctly. No additional measurement interval is implied.
Marking notes: Method marks remain available after an arithmetic error. Carry an earlier numerical error into a later valid step; award that method point if the unit conversion and physics are correct. A fully correct answer with unit earns all marks unless working is expressly requested.
2. Explain why a large gradient triangle and best-fit line are useful.
[2 marks]
Scope: 8463 and 8464 · Foundation and Higher
Show marking guidance and model answer
Original PhysicsUK mark scheme: Point 1 (1 mark): Well-separated points reduce the relative effect of reading uncertainty. Point 2 (1 mark): A fit uses the overall pattern rather than following random scatter from one raw point to another. Award each distinct point once. Accept equivalent scientifically correct wording. No half marks.
Well-separated points reduce the relative effect of reading uncertainty. (1 mark)
A fit uses the overall pattern rather than following random scatter from one raw point to another. (1 mark)
Model answer: A large triangle reduces percentage reading uncertainty, and a best-fit line represents the overall relationship despite random scatter.
Questions pupils ask
GCSE Physics Graph Skills FAQs
What makes an evidence-based conclusion stronger?
Name the numerical comparison or trend, link it to the physical claim, and acknowledge uncertainty that limits the strength of the conclusion.