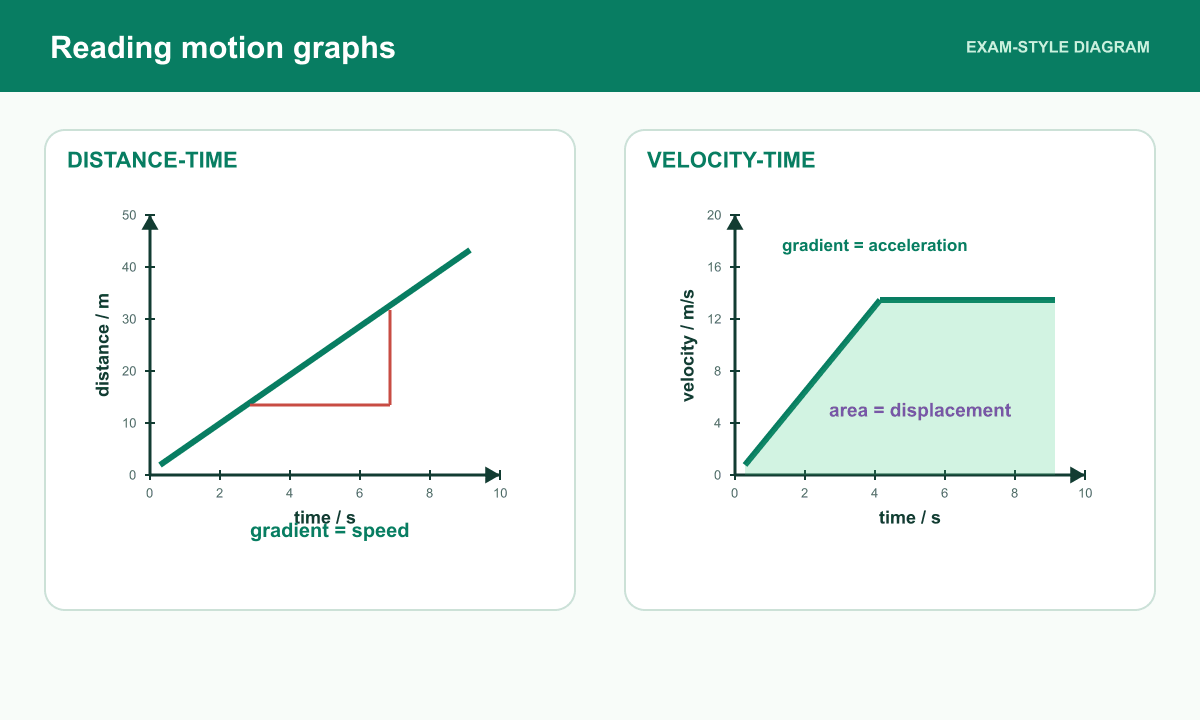
Read the vertical-axis quantity first. A flat distance–time line means rest; a flat velocity–time line can mean steady motion.
By the end, you should be able to:
Read speed and acceleration from graph gradients.
Distinguish negative velocity from negative acceleration.
Higher: calculate displacement from velocity–time area.
Before you revise
Diagnostic question
Choose an answer from memory. Your result tells you what to watch for in the guide.
Core revision guide
Learn the model, then use it
Read the vertical-axis quantity first. A flat distance–time line means rest; a flat velocity–time line can mean steady motion.
01
Distance–time gradients
Scope: 8463 and 8464 · Foundation and Higher
The gradient Δdistance/Δtime gives speed. A straight sloping line is constant speed; a steeper line means faster motion. A curved line has changing speed; a tangent gives instantaneous speed at a point (Higher). Distance travelled cannot decrease with time; a signed position/displacement axis is different.
02
Velocity–time gradients and direction
Scope: 8463 and 8464 · Foundation and Higher
Gradient Δv/Δt gives acceleration at both tiers. A negative gradient need not mean moving backwards: positive velocity with negative acceleration describes slowing forwards. A line crossing zero can indicate reversal if velocity changes sign. Higher: signed area gives displacement; adding area magnitudes gives distance travelled. The following triangular calculation uses this Higher area method.
03
A triangular motion stage
Scope: 8463 and 8464 · Higher only
A vehicle accelerating uniformly from 0 to 12 m/s in 6 s has a = 2 m/s². Its velocity–time triangle area is ½ × 6 × 12 = 36 m. Over another 4 s at 12 m/s the rectangle adds 48 m. The total is 84 m. Do not use the final speed for the whole accelerating stage.
Speedspeed = distance ÷ timem/s, m, sAccelerationa = Δv ÷ tm/s², m/s, s
Misconception clinic
Replace the tempting answer
Read each belief, say what is wrong with it, then compare your correction.
Tempting idea: At rest.
Use instead: Velocity is not zero. Positive velocity is constant.
Tempting idea: 40 m.
Use instead: That uses final speed throughout. Triangle area = ½ × 4 × 10.
Retrieval practice
Quick checks
Explore the relationship
Motion graph reader
Treat the gradient of this distance–time graph as speed, then calculate distance = gradient × time.
Model scope: 8463 and 8464 · Foundation and Higher
What to notice: use the readout to describe how one variable changes when the other is controlled.
Worked examples
See the method being built
Apply distance–time gradients in the worked reasoning, then try the changed-context questions below.
Example 1 · Distance-time gradient
Scope: 8463 and 8464 · Foundation and Higher
A runner travels 150 m in 30 s at constant speed. Find graph gradient.
Use speed = distance ÷ time.
Calculate 150 ÷ 30.
Give m/s.
Show the answer
Gradient = 5.0 m/s.
Example 2 · Velocity-time acceleration
Scope: 8463 and 8464 · Foundation and Higher
Velocity changes from 4.0 m/s to 16 m/s in 6.0 s. Find acceleration.
Use change in velocity ÷ time.
Calculate (16 − 4) ÷ 6.
Give m/s².
Show the answer
Acceleration = 2.0 m/s².
Example 3 · Velocity-time area
Scope: 8463 and 8464 · Higher only
A vehicle travels at 8.0 m/s for 5.0 s. Find displacement.
Area is rectangle under graph.
Multiply velocity by time.
Give metres.
Show the answer
Displacement = 40 m.
Exam precision
Use the physics precisely
Do this: Identify the graph axes first. Use a large gradient triangle for rates and, at Higher, divide the area into labelled geometric regions for displacement.
Independent practice
Exam-style questions
Write an answer before opening the marking guidance. Then edit the exact phrase or step that would gain the next mark.
1. Velocity increases uniformly from 3.0 m/s to 15 m/s in 6.0 s. Calculate acceleration.
[3 marks]
Scope: 8463 and 8464 · Foundation and Higher
Show marking guidance and model answer
Original PhysicsUK mark scheme: Point 1 (1 mark): a = (v − u)/t. Point 2 (1 mark): a = (15 − 3.0)/6.0. Point 3 (1 mark): a = 2.0 m/s². Award each distinct point once. Accept equivalent scientifically correct wording. No half marks.
a = (v − u)/t. (1 mark)
a = (15 − 3.0)/6.0. (1 mark)
a = 2.0 m/s². (1 mark)
Model answer: a = (v − u)/t. a = (15 − 3.0)/6.0. a = 2.0 m/s².
Acceptable answers: Expected result: a = 2.0 m/s². Accept the unrounded value or a correctly rounded equivalent to two or more significant figures; accept equivalent units if converted correctly. No additional measurement interval is implied.
Marking notes: Method marks remain available after an arithmetic error. Carry an earlier numerical error into a later valid step; award that method point if the unit conversion and physics are correct. A fully correct answer with unit earns all marks unless working is expressly requested.
2. Higher: velocity rises uniformly from rest to 8 m/s in 5 s. Calculate displacement.
[3 marks]
Scope: 8463 and 8464 · Higher only
Show marking guidance and model answer
Original PhysicsUK mark scheme: Point 1 (1 mark): Displacement = area under velocity–time graph. Point 2 (1 mark): s = ½ × 5 × 8. Point 3 (1 mark): s = 20 m. Award each distinct point once. Accept equivalent scientifically correct wording. No half marks.
Displacement = area under velocity–time graph. (1 mark)
s = ½ × 5 × 8. (1 mark)
s = 20 m. (1 mark)
Model answer: Displacement = area under velocity–time graph. s = ½ × 5 × 8. s = 20 m.
Acceptable answers: Expected result: s = 20 m. Accept the unrounded value or a correctly rounded equivalent to two or more significant figures; accept equivalent units if converted correctly. No additional measurement interval is implied.
Marking notes: Method marks remain available after an arithmetic error. Carry an earlier numerical error into a later valid step; award that method point if the unit conversion and physics are correct. A fully correct answer with unit earns all marks unless working is expressly requested.
Questions pupils ask
Motion Graphs, Speed and Acceleration FAQs
Does a downward velocity–time slope mean backward motion?
No. The slope gives acceleration; the sign of velocity gives direction. Positive velocity with a negative slope means slowing forwards.